Why a 7% Average Return Can Still Leave You Broke in Retirement
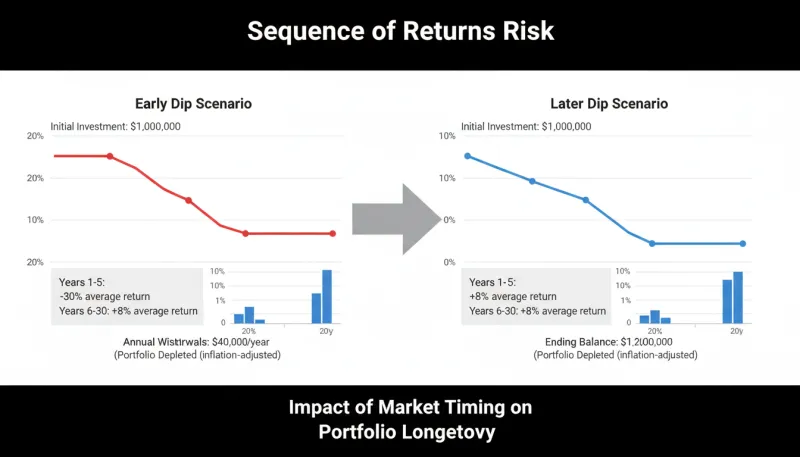
Photo: retirement portfolio planning graph declining market sequence risk, via toolsriver.com
Most investors spend their accumulation years fixated on average returns. They run projections, consult retirement calculators, and arrive at a number that feels reassuring—say, 7% annually over a 30-year horizon. The logic seems airtight: if the market delivers that average, the portfolio should last.
But retirement income does not operate on averages. It operates on sequences. And the sequence in which your returns arrive during the withdrawal phase of your financial life can determine whether your money outlasts you—or runs out a decade too soon.
This is the sequence-of-returns trap, and it is one of the most consequential mathematical realities every investor must understand before drawing their first dollar from a retirement account.
The Mathematics Behind the Risk
During the accumulation phase—when you are adding money to a portfolio rather than removing it—the sequence of annual returns is largely irrelevant to your ending balance. Whether the market surges in year one and stumbles in year twenty, or vice versa, the final value of a lump sum investment without withdrawals is determined by the average compounded return, not the order of individual years.
The moment you begin making systematic withdrawals, that mathematical symmetry collapses.
Consider two retirees, each beginning with a $500,000 portfolio and withdrawing $25,000 annually. Both experience the same set of annual returns over a 20-year period—the same numbers, simply arranged in reverse order. Retiree A encounters strong positive returns in the early years, followed by a significant downturn near the end. Retiree B faces the downturn first, then enjoys the recovery.
The average return is identical for both. The outcome is not. Retiree A finishes the period with a portfolio that remains viable. Retiree B, who sold shares at depressed prices during the early years to fund withdrawals, may exhaust the portfolio well before year twenty.
This is not a theoretical curiosity. It is an arithmetic certainty. Selling assets at low prices to meet living expenses permanently removes shares that would otherwise participate in the eventual recovery. The damage compounds in reverse.
Historical Sequences That Illustrate the Stakes
The early 2000s offer a particularly instructive case study. An investor who retired in January 2000 with a portfolio heavily weighted toward equities immediately encountered the dot-com collapse, followed by a modest recovery, and then the financial crisis of 2008–2009. Two severe downturns within the first decade of retirement, precisely when the portfolio was at its largest and withdrawals were at their most damaging, created conditions that many retirees did not survive financially.
By contrast, an investor who retired in 1990 experienced a decade of exceptional equity performance before the turbulence arrived. By the time the dot-com bust materialized, that retiree had already accumulated a substantial buffer—a longer runway of favorable compounding that provided meaningful insulation against subsequent volatility.
Same asset class. Same general era. Dramatically different outcomes, driven almost entirely by the timing of market stress relative to the retirement date.
The 1966 cohort of retirees faced a similarly punishing sequence. Persistent inflation throughout the 1970s eroded real purchasing power while nominal portfolio values stagnated. Retirees who had planned conservatively around historical averages found those averages provided cold comfort when the sequence of real returns proved deeply unfavorable for more than a decade.
Why Behavioral Responses Often Amplify the Damage
Sequence-of-returns risk is not purely a mathematical problem. It is also a behavioral one, and the two dimensions interact in ways that can accelerate portfolio depletion.
When markets decline sharply in the early years of retirement, many investors respond by reducing or eliminating equity exposure—a response that feels rational in the moment but eliminates any possibility of participating in the recovery that typically follows. The portfolio locks in its losses at precisely the wrong time.
Others respond to early declines by increasing withdrawals to maintain their lifestyle, reasoning that the market will recover and replenish what was taken. This compounds the mathematical damage of selling at depressed prices with an accelerated withdrawal rate, a combination that can be catastrophic to long-term sustainability.
Understanding the mechanics of sequence risk in advance does not eliminate the emotional pressure of watching a portfolio decline in retirement. But it does provide a framework for making decisions based on strategy rather than anxiety.
Building a Blueprint That Accounts for Sequence Risk
Several strategies exist to reduce vulnerability to an unfavorable return sequence. None eliminates the risk entirely, but each addresses a different dimension of the problem.
The bucket approach segments a retirement portfolio into distinct time horizons. Near-term living expenses—typically covering two to five years—are held in cash or short-term fixed-income instruments. Intermediate and long-term buckets hold progressively more growth-oriented assets. When equity markets decline, withdrawals are drawn from the conservative near-term bucket rather than from depreciated equity positions, preserving the time needed for growth assets to recover.
Dynamic withdrawal strategies replace a fixed annual withdrawal rate with a flexible spending framework that adjusts based on portfolio performance. In strong years, spending may modestly increase. Following a downturn, discretionary spending is reduced to allow the portfolio to recover. This flexibility meaningfully extends portfolio longevity compared to rigid withdrawal schedules.
Partial annuitization converts a portion of the portfolio into guaranteed lifetime income, typically through a single premium immediate annuity. By covering essential expenses with guaranteed income, the investor reduces the volume of forced equity liquidations during downturns. The remaining portfolio can be managed with a longer time horizon and higher equity allocation, potentially improving long-term growth prospects.
Delaying Social Security functions as a sequencing hedge in its own right. Each year of delayed claiming between ages 62 and 70 increases the eventual benefit by approximately 6% to 8%. A higher guaranteed Social Security benefit reduces dependence on portfolio withdrawals, directly limiting exposure to sequence risk during the critical early years of retirement.
Reframing How You Think About Retirement Returns
The conventional retirement planning conversation focuses heavily on accumulation—how much to save, what return to assume, when to start. These questions matter. But they are incomplete without an equally serious conversation about the distribution phase and the unique risks it introduces.
A 7% average return is not a promise. It is a historical approximation that obscures enormous variability in how individual decades of returns are distributed. For an investor in the accumulation phase with decades ahead, that variability is largely irrelevant. For a retiree drawing down a portfolio, it is the central variable.
The investors who navigate retirement most successfully are not necessarily those who achieved the highest average returns. They are those who understood that the sequence of those returns—and their behavioral response to adverse sequences—would ultimately determine whether their financial blueprint held together under real-world conditions.
Building a retirement strategy that explicitly accounts for sequence-of-returns risk is not pessimistic. It is precise. And in a discipline where the margin for error narrows considerably once the paychecks stop, precision is everything.