Mirror Returns, Divergent Fortunes: The Hidden Portfolio Killer Most Investors Never See Coming

Photo: retirement portfolio planning financial graph diverging paths, via mycvcreator.com
When the Math Looks Right but the Outcome Goes Wrong
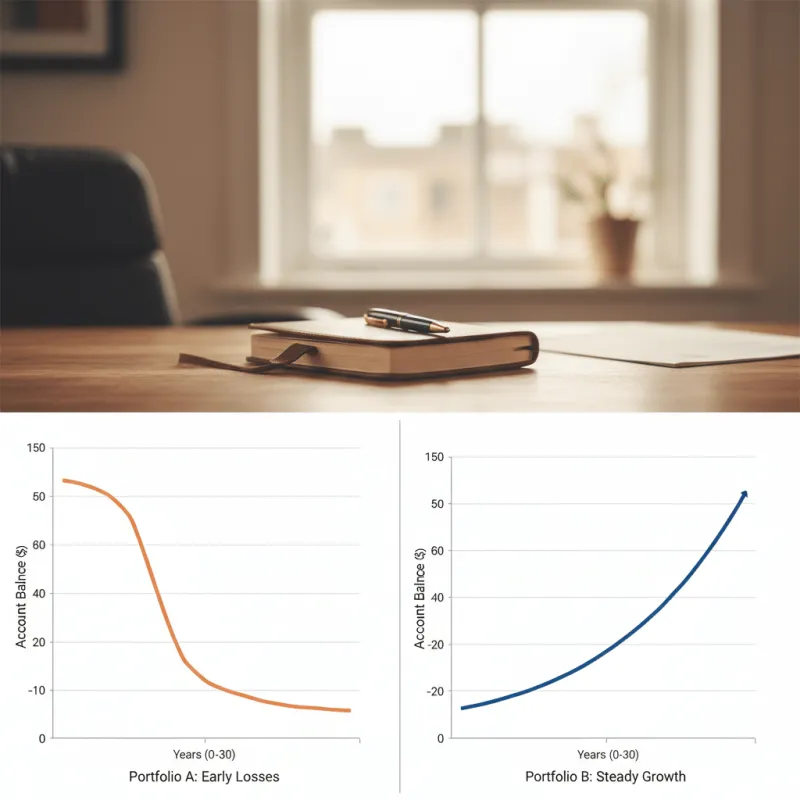
Imagine two investors — call them Patricia and Robert — who each contribute to their retirement portfolios for thirty years and each achieve an average annual return of exactly 8%. By conventional financial logic, they should retire with comparable nest eggs. In reality, Patricia retires with $1.4 million while Robert retires with just under $900,000. No errors were made. No fees were dramatically different. The only meaningful distinction between their two journeys was the order in which their gains and losses occurred.
This is the sequence of returns risk — arguably the most underappreciated threat in long-term investing, and one that becomes especially dangerous for those approaching or already in retirement.
The Mechanics Behind the Disparity
Averages are seductive. When a financial advisor tells you a diversified portfolio has historically returned 8% annually, your brain instinctively translates that into a smooth, predictable upward line. But markets do not operate on a schedule. They surge, stall, and collapse in patterns that defy prediction — and the timing of those movements relative to your withdrawals or contributions creates outcomes the average simply cannot capture.
During the accumulation phase — the years when you are actively adding money to your portfolio — poor early returns are painful but recoverable. You are still buying shares, and a down market in your thirties means you are acquiring assets at lower prices. Time is working in your favor.
The calculus reverses entirely once you begin drawing down. If a significant market decline occurs in the first few years of retirement, you are forced to sell assets at depressed prices to meet living expenses. Those shares are gone permanently. They will never participate in the eventual recovery. This is the mechanism that transforms two investors with identical average returns into retirees with vastly different financial realities.
A Concrete Illustration
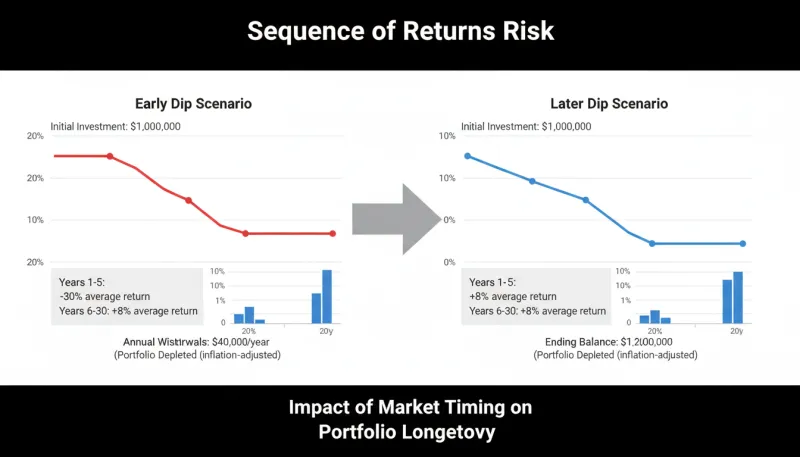
Consider a simplified example. Two retirees each begin with a $500,000 portfolio and withdraw $30,000 annually. Investor A experiences strong returns early — 15%, 12%, 10% — followed by a severe downturn in years four and five. Investor B experiences the identical sequence in reverse: the steep losses arrive first, followed by the strong recovery years.
Despite the same average return over the full period, Investor B's portfolio is depleted years before Investor A's. The early withdrawals during down markets lock in losses at the worst possible moment, and the subsequent recovery — while mathematically identical — has a dramatically smaller asset base to work with.
This is not a theoretical edge case. It is a structural feature of how withdrawals interact with volatility.
What Monte Carlo Simulations Reveal
Financial planners increasingly rely on Monte Carlo simulations to stress-test retirement portfolios against this risk. Rather than projecting a single average return, these tools run thousands of randomized return sequences — drawing from historical volatility patterns — to estimate the probability that a portfolio survives a given withdrawal rate over a specified time horizon.
The results are sobering. A portfolio built around a 4% withdrawal rate and a projected 8% average return might succeed in 85% of simulated scenarios. But that remaining 15% — the scenarios where the portfolio fails — is not randomly distributed. It clusters heavily around simulations where significant losses occur in the early retirement years. The average return in those failed scenarios is often still close to 8%. The sequence, not the average, is what kills the portfolio.
For investors in their late fifties and early sixties, this data point deserves serious attention. The decade straddling your retirement date — roughly five years before and five years after — represents your greatest window of vulnerability to sequence risk.
Strategies to Reduce Your Exposure
The encouraging news is that sequence of returns risk is manageable. It requires deliberate planning rather than passive reliance on long-run averages, but the tools available to US investors are practical and well-established.
Build a cash buffer before retirement. Maintaining one to two years of living expenses in cash or short-term instruments allows you to avoid selling equities during a downturn. When markets decline sharply, you draw from the buffer rather than liquidating positions at depressed prices. This simple step can significantly reduce the damage inflicted by an early-retirement bear market.
Adopt a bucket strategy. This approach segments your portfolio into time-based layers. Bucket one holds near-term expenses in stable, liquid assets. Bucket two holds intermediate-term needs in bonds and dividend-paying equities. Bucket three holds long-term growth assets in stocks. When markets fall, you spend from bucket one while bucket three recovers — avoiding the forced-sale trap entirely.
Consider a dynamic withdrawal strategy. Rather than withdrawing a fixed dollar amount annually, adjust your withdrawals based on portfolio performance. In strong years, take slightly more. In down years, reduce spending modestly. Research from financial economists suggests this flexibility can meaningfully extend portfolio longevity without requiring dramatic lifestyle changes.
Evaluate annuity products strategically. A portion of your retirement income guaranteed through an annuity — particularly a deferred income annuity or a single premium immediate annuity — removes some of the sequence risk from your equity portfolio by ensuring baseline expenses are covered regardless of market conditions. This is not a recommendation to annuitize everything, but rather to consider the role guaranteed income plays in insulating your investment portfolio from forced early withdrawals.
Maintain a glide path toward lower volatility. Transitioning a portion of your equity exposure into bonds and dividend-focused equities as you approach retirement reduces the magnitude of potential losses during your most vulnerable years. This does not eliminate sequence risk, but it compresses the range of outcomes.
Rethinking How You Measure Investment Success
One of the most important shifts an investor can make — particularly as retirement approaches — is to stop evaluating portfolio performance purely through the lens of average returns. The average is a useful benchmark during accumulation, but it becomes an incomplete and potentially misleading metric once withdrawals begin.
A more relevant question is: What is the probability that my portfolio sustains my lifestyle through a 25- or 30-year retirement under realistic market conditions, including the possibility of early losses? That question demands a different kind of analysis — one that accounts for sequence, volatility, and withdrawal timing rather than simply averaging decades of returns into a single number.
The Blueprint Takeaway
Sequence of returns risk does not announce itself. It operates quietly, embedded in the mathematics of compounding and withdrawal, invisible to investors who focus only on long-run averages. Two investors can follow identical strategies, achieve identical average returns, and arrive at retirement in dramatically different financial positions — all because of when the market chose to deliver its worst years.
Building a retirement plan that accounts for this reality is not pessimistic. It is precise. It means stress-testing your assumptions, building structural buffers, and designing a withdrawal strategy that does not depend on the market cooperating during the years you can least afford for it not to. That kind of disciplined, evidence-based planning is what separates investors who merely accumulate wealth from those who successfully preserve and deploy it across a lifetime.