Fear as a Signal: How Contrarian Investors Use Sentiment Indicators to Find Opportunity in Market Chaos
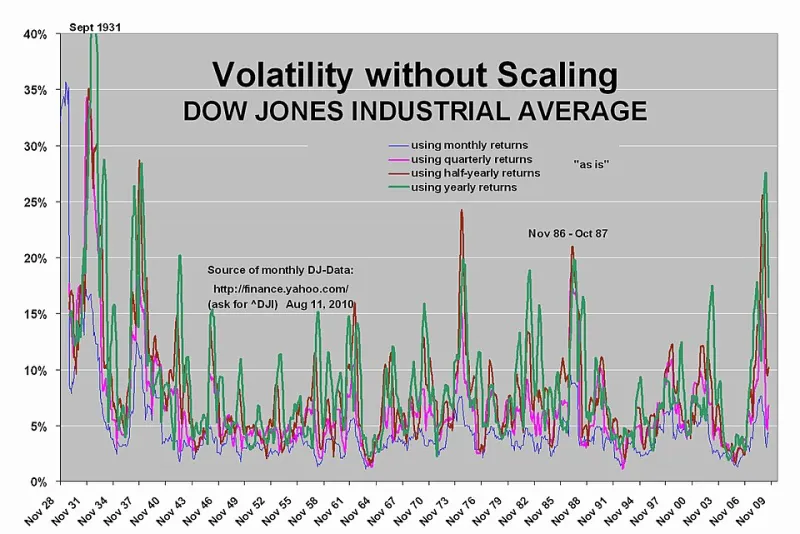
Photo: Gaschroeder, Public domain, via Wikimedia Commons
The Paradox at the Heart of Market Panics
There is a counterintuitive truth embedded in the history of U.S. financial markets: some of the most profitable entry points for long-term investors have occurred at the precise moments when public sentiment was at its most negative. The March 2009 lows following the global financial crisis, the brief but violent COVID-19 collapse of February and March 2020, and the sharp drawdowns of 2022 all presented conditions that felt catastrophic in real time—and, in retrospect, offered extraordinary opportunities for those who could distinguish between genuine systemic risk and fear-driven overreaction.
The discipline that allows certain investors to act during these moments is not recklessness. It is the product of a structured approach to reading market sentiment—one that relies on quantifiable indicators rather than instinct or media headlines.
What Sentiment Indicators Actually Measure
Sentiment indicators are tools that attempt to quantify the collective emotional state of market participants at a given point in time. Unlike fundamental analysis, which evaluates a company's earnings, balance sheet, and competitive position, sentiment analysis asks a different question: not whether an asset is worth a certain price, but whether the crowd's emotional state has pushed prices away from rational valuation.
This distinction matters because markets are not purely rational mechanisms. They are driven by human psychology, and human psychology is subject to systematic biases—most notably, the tendency to extrapolate recent experience indefinitely into the future. When prices fall sharply, many investors assume they will continue to fall. That assumption, when held widely enough, can drive prices below any defensible fundamental value. That gap between price and value is where contrarian opportunity lives.
The VIX: Wall Street's Fear Gauge
The CBOE Volatility Index, universally known as the VIX, measures the market's expectation of near-term volatility based on S&P 500 options pricing. When investors are calm and confident, implied volatility is low, and the VIX trades in a range of roughly 12 to 20. When fear accelerates, the VIX climbs rapidly—often spiking above 30, 40, or even higher during acute crises.
During the COVID-19 market collapse of March 2020, the VIX briefly exceeded 80, a level approached only once before in the index's history, during the 2008 financial crisis. Investors who interpreted that spike not as a signal to sell remaining positions, but as a potential indicator of maximum fear, were positioned to benefit from one of the fastest recoveries in market history.
The VIX is not a timing tool with precision. It does not tell an investor when the market will recover. What it does provide is context: a reading above 35 or 40 has historically corresponded with periods of elevated prospective returns for patient investors willing to tolerate continued short-term volatility.
The Put/Call Ratio: Measuring the Balance of Conviction
Options markets offer another window into collective sentiment through the put/call ratio—a measure of the volume of bearish put options purchased relative to bullish call options. Under normal market conditions, the ratio fluctuates around 0.7 to 0.9. When investors grow fearful and rush to purchase downside protection, the ratio rises. When it climbs above 1.2 or higher on a sustained basis, it often signals that pessimism has reached an extreme.
Contrarian investors treat elevated put/call ratios as a potential sign that the consensus bearish view has become overcrowded. When nearly everyone has already positioned for further declines, the incremental selling pressure diminishes—and any positive catalyst can trigger a sharp reversal as those hedges are unwound.
Conversely, an unusually low put/call ratio—indicating widespread complacency—can serve as a cautionary signal that markets may be vulnerable to a correction.
Insider Buying: The Quietest Signal in the Room
Corporate insiders—executives, directors, and major shareholders—are required by the SEC to report their open-market purchases and sales within two business days. This data, publicly available through SEC Form 4 filings, provides a unique form of sentiment information: the revealed preferences of individuals with the most direct knowledge of a company's prospects.
Research has consistently shown that clusters of insider buying activity—particularly when multiple insiders at the same company purchase shares simultaneously during a market downturn—have historically been associated with above-average forward returns. Insiders rarely buy in anticipation of continued deterioration. When they deploy personal capital into their own company's stock during a period of broad market fear, it represents a meaningful data point that the sell-off may have been excessive relative to underlying business fundamentals.
Tracking insider activity requires no special access. Platforms such as SEC.gov's EDGAR database, as well as numerous financial data aggregators, compile Form 4 filings in near-real time.
Case Studies in Contrarian Discipline
The 2008 to 2009 financial crisis provides perhaps the most studied example of sentiment extremes creating long-term opportunity. By early March 2009, the S&P 500 had declined approximately 57% from its October 2007 peak. The VIX had reached historic levels. Put/call ratios were elevated. And yet, insider buying across the financial sector—the epicenter of the crisis—was accelerating. Investors who incorporated these signals into their decision-making framework, and who had the psychological fortitude to act on them, participated in a subsequent decade of sustained appreciation.
The 2020 COVID collapse followed a similar pattern compressed into a shorter window. Fear indicators spiked violently in late February and March. Insider purchases surged. The recovery, in this case, began within weeks—rewarding those who recognized the sentiment extreme rather than reacting to the headlines driving it.
The Limits of Sentiment Analysis
A responsible treatment of this subject requires acknowledging what sentiment indicators cannot do. They are not predictive in any precise sense. Sentiment can remain extreme for longer than expected, and markets can decline further even after fear indicators reach historically elevated levels. The 2008 crisis, for instance, saw multiple periods of apparent capitulation before the ultimate bottom was established.
Sentiment analysis is most valuable when used in conjunction with fundamental valuation—when an investor can identify assets that are both statistically cheap and emotionally oversold. Neither condition alone is sufficient. Together, they represent a more durable basis for contrarian positioning.
Reading the Room With Discipline
The investors who consistently benefit from market panics are not those who are indifferent to fear. They are those who have developed a structured framework for evaluating it—one that separates the signal from the noise and allows for deliberate action when the crowd is least capable of it.
For investors committed to building long-term wealth, learning to read sentiment indicators is not about predicting markets. It is about understanding when the emotional temperature of the market has created a divergence between price and value—and having the preparation and discipline to act on that divergence when it appears.