The $100,000 Mistake: How Selling During a Market Correction Can Derail Your Entire Financial Future
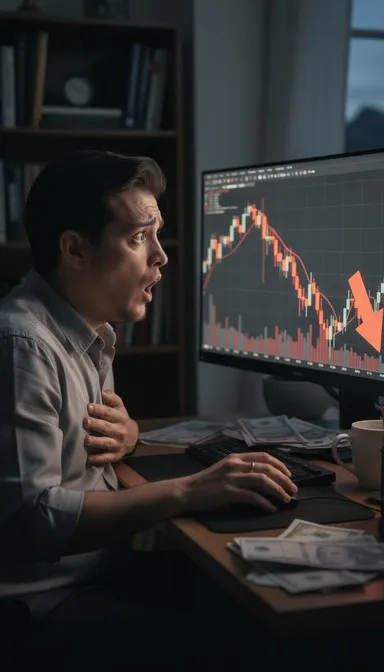
Photo: stressed investor watching stock market decline on computer screen, via images.stockcake.com
Consider a scenario that has repeated itself, with remarkable consistency, throughout the history of U.S. financial markets: stocks fall sharply, headlines turn apocalyptic, and millions of ordinary investors — gripped by a visceral fear of further losses — sell their holdings and retreat to cash. Then, within weeks or months, the market recovers. Often violently. And those same investors, waiting for conditions to feel safer before returning, miss the rebound entirely.
This is not a hypothetical. It is a documented pattern with real, measurable consequences. And for aspiring investors attempting to build long-term wealth, understanding why this happens — and how to guard against it — may be the single most valuable lesson this publication can offer.
What a 10% Correction Actually Means
By technical definition, a market correction occurs when a major index such as the S&P 500 declines 10% or more from a recent peak. Corrections are not anomalies. They are, historically speaking, routine features of a functioning market. Since 1950, the S&P 500 has experienced a correction of 10% or greater approximately once every 1.2 years on average.
Yet each time one arrives, it generates a level of media coverage and investor anxiety that suggests something unprecedented is occurring. Financial news networks run continuous coverage. Social media fills with predictions of imminent collapse. And retail investors, many of whom lack the historical context to evaluate the moment objectively, make decisions driven by emotion rather than evidence.
The critical distinction that experienced investors understand — and that newer participants often do not — is the difference between a correction and a structural bear market signaling genuine economic deterioration. Corrections are typically temporary price adjustments. Bear markets, defined as declines exceeding 20% sustained over a prolonged period, are rarer and generally accompanied by fundamental economic weakness.
Confusing the two is expensive.
The Behavioral Finance Behind the Panic
The field of behavioral finance offers a compelling explanation for why intelligent, otherwise rational people make poor investment decisions during periods of market stress. Two concepts are particularly relevant.
The first is loss aversion, a principle identified by psychologists Daniel Kahneman and Amos Tversky. Their research demonstrated that the psychological pain of losing a dollar is approximately twice as powerful as the pleasure derived from gaining one. This asymmetry means that a 10% portfolio decline generates a level of emotional distress that a 10% gain simply does not offset — creating a powerful internal pressure to act, to stop the pain, to sell.
The second is recency bias — the cognitive tendency to assign disproportionate weight to recent events when forecasting future outcomes. When markets have been falling for three consecutive weeks, the human brain begins to treat continued decline as the most probable scenario, even when historical base rates suggest otherwise.
Together, these two biases create what behavioral economists sometimes call the "panic loop": falling prices generate fear, fear generates the impulse to sell, selling locks in losses, and the subsequent recovery is observed from the sidelines with a mixture of regret and frustration.
The Historical Record Is Unambiguous
The cost of panic selling is not theoretical — it can be calculated with reasonable precision using historical market data.
Consider the COVID-19 market crash of February and March 2020. Between February 19 and March 23, the S&P 500 fell approximately 34% in just 33 calendar days — one of the fastest declines in market history. The headlines during that period were genuinely alarming: a global pandemic, widespread economic shutdowns, and no clear timeline for recovery.
An investor who sold their equity holdings at or near the bottom on March 23, 2020, and waited until conditions felt "stable" before re-entering — say, in early June of that year — would have missed a recovery of more than 40% from the trough. On a $100,000 portfolio, that decision represents approximately $40,000 in foregone gains, before accounting for the compounding effect of those gains over subsequent years.
Extend that analysis over a decade, and the opportunity cost grows considerably larger.
The 2008 financial crisis offers a similar lesson. Investors who held their positions through the crisis and into the recovery saw the S&P 500 more than triple between its March 2009 low and 2013. Those who exited near the bottom and waited for certainty — which, by definition, never arrives — captured little of that recovery.
Distinguishing Noise From Signal
None of this is to suggest that investors should ignore all warning signs and hold passively through every market environment. There are genuine signals worth monitoring. The challenge is developing the analytical discipline to separate meaningful deterioration from ordinary volatility.
Several indicators merit attention during periods of market stress:
Credit spreads — the difference in yield between corporate bonds and U.S. Treasuries — tend to widen significantly during genuine financial crises as lenders price in elevated default risk. A sharp, sustained widening of credit spreads is a more reliable warning sign than a 10% equity decline in isolation.
Earnings revisions provide insight into whether corporate fundamentals are deteriorating or whether the market is simply repricing based on sentiment. If analysts are broadly cutting forward earnings estimates, the decline may reflect something more substantive than temporary fear.
Federal Reserve policy signals and the broader interest rate environment can meaningfully affect equity valuations, particularly for growth-oriented sectors. Understanding the macro context surrounding a selloff helps investors assess whether the decline is sentiment-driven or structurally motivated.
If these indicators remain relatively stable during a correction, the probability is high that you are witnessing market noise rather than a fundamental breakdown.
Building the Psychological Infrastructure to Hold
Knowing that panic selling is destructive and actually refraining from it during a sharp drawdown are two very different things. The gap between them is bridged by preparation.
Investors who have documented a written investment policy — a clear statement of their goals, time horizon, risk tolerance, and intended asset allocation — are meaningfully better equipped to withstand volatility. When fear is highest, that document becomes an anchor. It reminds the investor that the plan was constructed during a period of calm, rational deliberation, and that the current emotional environment is precisely the wrong context for major portfolio decisions.
Automated investing strategies, such as setting up recurring contributions through a 401(k) or brokerage account, also reduce the opportunity for emotional interference. When contributions occur automatically regardless of market conditions, dollar-cost averaging works in the investor's favor — purchasing more shares at lower prices during corrections.
Finally, reframing corrections as routine events rather than emergencies is a skill that develops with experience and education. The investor who understands that corrections are a predictable feature of long-term equity ownership — not a malfunction — is far less likely to mistake a temporary decline for a permanent catastrophe.
The Blueprint Holds When the Market Doesn't
Market corrections are, in a meaningful sense, a test. Not of the market's integrity, but of yours. They reveal whether your investment strategy is built on a genuine understanding of how markets function or on a tolerance for risk that evaporates the moment it is actually tested.
The investors who build lasting wealth are not those who successfully predicted every downturn. They are the ones who remained invested, continued contributing, and allowed time and compounding to do the work that no market-timing strategy can reliably replicate.
Your blueprint is only as strong as your commitment to following it when conditions are difficult. That commitment begins with understanding what market corrections actually are — and what they are not.